Why a Live Groundwater Map Won't Tell You Where to Drill
Every week, thousands of people across India search for a "live groundwater map." They want to open a portal, drop a pin on their land, and see how much water is beneath them. It's a completely logical thing to want. And it's exactly the wrong tool for the job. Here's why — and what actually works.
GROUNDWATER INTELLIGENCE
What Live Groundwater Maps Actually Show
Platforms like ISRO's Bhuvan-Bhujal portal, CGWB's Water Information Management System (WIMS), and several state groundwater dashboards do something genuinely useful: they map groundwater levels across regions using a network of monitoring wells.
These tools tell you that, say, the northern blocks of Telangana have experienced a 4-metre decline in water table over the last decade. Or that pre-monsoon groundwater levels in parts of Andhra Pradesh are critically below seasonal norms.
That is important data. For policy makers, urban planners, and agricultural departments, it is exactly what they need.
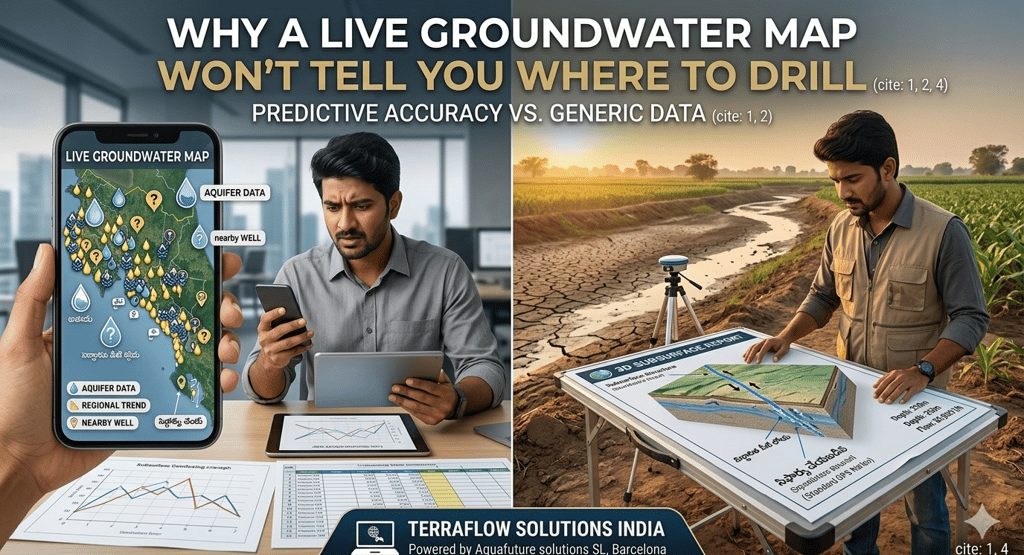
But if you are a landowner, a real estate developer, or an industrial project manager deciding whether — and where — to drill a borewell on a specific plot of land, that regional picture does not answer your question.
The Problem With "My Location" Groundwater Data
When someone searches "groundwater level in my location," they are really asking: "If I drill here, will I find water — and is it worth the cost?"
Regional monitoring data cannot answer that question. Here is why.
Scale mismatch. A monitoring well serves a radius of several kilometres. Your plot is a few hundred metres wide at most. The aquifer behaviour beneath your specific land — shaped by the local geology, fracture orientation, rock structure, and depth — is invisible to regional-scale sensors.
Fracture zones are local, not regional. In hard rock terrain, which covers more than 65% of India's land surface (CGWB), water does not sit in uniform underground pools. It moves through fractures, faults, and weathered zones — veins that can be just 20–30 metres wide and run at specific angles through the subsurface. A regional map cannot see them. It averages over them.
The map shows water stress, not water location. A "high depletion" zone on a satellite map does not mean there is no water. It means surface-dependent aquifers are under pressure. Deep fracture zones, rechargeable veins, and structural water bodies can still yield reliable water at depth — if you know exactly where to drill.
What Happened at Kayseri, Turkey
In Kayseri, Turkey, a project requiring reliable water supply drilled two boreholes using conventional GIS and regional geological mapping. Both failed. Combined loss: over €5 million.
The regional data was not wrong. The boreholes were simply placed without precise subsurface intelligence — without knowing the exact strike direction, depth, and yield potential of the fracture zone that held the water.
A Ground Property Report (GPR) was then commissioned using satellite-based remote analytical intelligence — integrating AI-driven modelling, satellite imagery, geological database archives, and structural and geomorphological analysis. No site visits. Pure data intelligence.
The GPR identified a specific fracture vein. The third borehole, drilled to 430 metres in the precise direction indicated, struck water at 57 cubic metres per hour. The groundwater temperature — 53°C — confirmed it was a deep, pressurised, rechargeable source.
Same region. Same "groundwater stress" on the regional map. Completely different outcome — because the intelligence was specific, not general.
The Difference Between a Map and Intelligence
A live groundwater map is observation data. It tells you the state of a system at a regional scale.
A Ground Property Report is decision-grade intelligence. It tells you the subsurface risk profile of your specific coordinates — fracture zones, geological layering, vein orientation, confidence in yield — so you can decide whether to drill, where to drill, and how deep to go.
The five-layer geological sequence that GPR analysis resolves, sourced from CGWB and NAQUIM research:
Surface Soil (0–5m) — weathering zone, high permeability variation
Saprolite / Weathered Layer (5–30m) — partially decomposed rock, moderate yield potential
Semi-Weathered Layer (30–80m) — transitional zone, risk assessment critical here
Secondary Fracture Layer / Fracture Zone (80–200m) — the primary GPR target; where rechargeable veins are identified
Basement (200m+) — consolidated crystalline rock, largely impermeable
No live map resolves this profile at your coordinates. GPR does.
At Laxmapoor, Nizamabad — Validation in the Field
In Laxmapoor Village, Chandur Mandal, Nizamabad District, a cold water vein running SE–NW at 200 metres depth was identified by GPR analysis. The predicted yield: 2.1 litres per second. Water was struck exactly as predicted.
The regional groundwater maps for this part of Telangana would have told you only that the area is in a hard rock terrain with moderate groundwater prospects. It would not have told you the vein direction, the depth, or the yield. The GPR did.
What You Should Actually Search For
If you are trying to make a drilling decision, what you need is not a live map. You need a pre-drill risk assessment — a document that tells you the specific subsurface conditions at your site before you spend ₹3–8 lakh on a borewell that may or may not find water.
TerraFlow Solutions India provides exactly that — a Ground Property Report (GPR) delivered within 48 hours of receiving your coordinates. No site visits. No waiting weeks for a field survey. Pan-India coverage.
🇺🇳 Aligned with UN SDG 6 (Clean Water and Sanitation) and SDG 15 (Life on Land), TerraFlow's pre-drill intelligence supports India's IGBC Net Zero Water framework by ensuring every borewell committed to is the right borewell.
Before you drill, know what's below.
Request a Ground Property Report → terraflowsolutions.in
TerraFlow Solutions India is the Official India Partner of Aquafuture Solutions S.L., Barcelona, Spain.